Perhaps the biggest lesson to be taken from the seismic events of the last five months, at least for corporate treasury and finance professionals, is that instant access to real-time data is not a luxury but a necessity.
At its height, the economic fallout caused by the global outbreak of the coronavirus unfolded almost by the hour. Businesses had to react accordingly, and those who had immediate visibility over their current and projected cash and liquidity positions were better placed to do so.
With senior management demanding daily updates on cash flow data and KPIs, piled on top of their already extensive cash reporting requirements, the onus was on head office treasury and finance teams to communicate that information with exceptional speed and clarity.
Cash Flow Dashboards
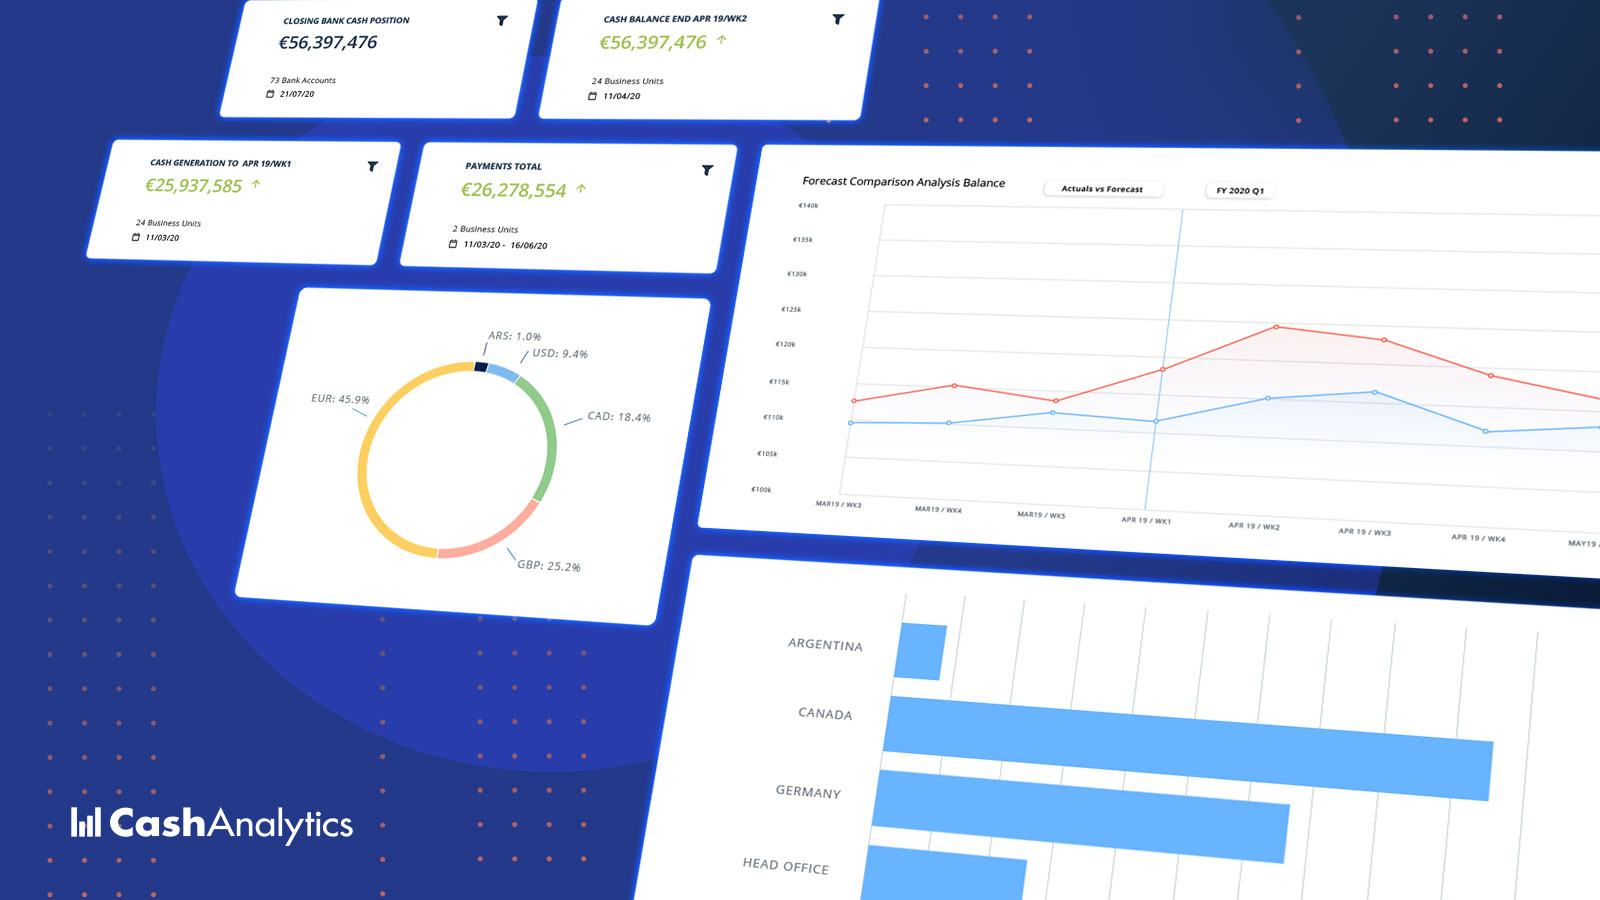
It is in such heightened situations that the inherent value of a cash flow dashboard becomes all too clear.
Cash and liquidity dashboards display real-time data, generated by cash reporting and forecasting processes and systems, that matter most to businesses and their audience. What’s more, they focus all attention on a single version of the truth that is easy to understand and digest.
At a moment’s notice, dashboards can also be rolled into reports and circulated to the relevant stakeholders, who have the option to take a headline view or drill down to the most granular level of detail.
A cash flow dashboard, however, is only worthwhile when serving an objective. Companies must first decide what KPIs most accurately reflect their financial performance, and are therefore eligible for the dashboard treatment.
Dashboard Metrics and KPIs
KPIs vary from business to business. But in our experience here in CashAnalytics, where we provide cash forecasting and liquidity planning solutions to multinational organizations worldwide, the following five metrics generally, though not exclusively, take center stage on the dashboards:
- Consolidated Actual and Forecast Cash Positions
- Total Actual and Forecast Available Liquidity
- Net Debt and Covenants
- Variance and Actual versus Forecast Analysis
- Cash Walkthrough
1. Consolidated Actual and Forecast Cash Positions
Large businesses, especially those with a global presence, often struggle to achieve an up-to-date, single-currency centralized cash position, showing both current cash levels and forecast cash levels at certain points in the future.
This is perfectly understandable, given the number of subsidiaries and bank accounts involved. With bank data and forecasts feeding directly into the dashboards, however, a real-time view of daily consolidated actual and forecast cash positions is available with the click of a mouse.
These consolidated actual and forecast positions – with the data that sits behind them related to business units, bank accounts, and many other aspects of the company – are the backbone of all other cash reporting.
2. Total Actual and Forecast Available Liquidity
Once more, the sheer number of moving parts makes the task of calculating current and forecast liquidity an onerous one, but not impossible.
Liquidity reporting layers external sources of available liquidity on top of internally available cash reserves.
During the peak of the COVID-19 pandemic, companies tapped these liquidity reserves en-masse as they scrambled to add another layer of security by converting as much of them as possible into cash.
Most large companies will have multiple sources of external liquidity spread across their business. Aggregating these liquidity sources, then combining them with cash reserves to show total available actual and forecast liquidity, is a must for dashboards.
3. Net Debt and Covenants
While not purely cash and liquidity metrics, net debt and covenant metrics are closely related to cash and liquidity and too important to ignore. Cash and drawn liquidity are key components of the net debt number and, ultimately, covenant calculations.
Significant movements in cash flow over a short period, or more gradually over time, have a profound impact on net debt and covenant levels, particularly if underlying earnings are moving in the wrong direction. This will likely restrict a company’s ability to access liquidity and to use the cash generated in the way it was originally intended (e.g. cap-ex.).
Because of their importance, net debt and covenants figures need to be put up in lights for all relevant stakeholders to see.
Further Reading
- Why Companies Automate Cash Forecasting
- How to Extend the Cash Flow Projection Horizon
- Key Cash Flow Metrics All Large Companies Must Track
- Why All Our Clients Use Rolling Cash Flow Forecasts
4. Variance and Actual versus Forecast Analysis
It may seem counterintuitive to highlight actual versus forecast differences and variances on a dashboard consumed by executives and other senior stakeholders. However, if managed correctly, it can add huge credibility to both the overall cash reporting process and the dashboard itself.
Furthermore, highlighting and explaining a large variance puts the owner of the dashboard, generally the head office finance or treasury team, in control of the process by heading off inevitable questions before they are asked.
Providing high-level forecast variance analysis on the dashboard helps all consumers understand the major items impacting forecast accuracy and ensures the quality of the data is continuously monitored.
5. Cash Walkthrough
A cash walkthrough allows companies to visualize every step taken from an opening cash balance to a closing cash balance. The journey is broken down into a series of stages that showcase what has impacted, positively and negatively, the net cash balance.
Using a graph to visualize the salient data, headline cash inflow categories, such as customer receipts and investing inflow, are color-coded. So, too, are the primary cash outflows, which might include supplier payments or tax.
A primary benefit of visualizing data in this way is that it underlines the influence each cash flow category has had on the cash balance. For example, with a cash walkthrough graph, a treasurer or financial planner would be able to quickly flag that supplier payments had offset the combined contribution of customer receipts, investing inflow, and dividend receipts.
A Clear Pathway
This is just a small sample of the metrics and KPIs that are trackable, in real-time, on cash flow dashboards. There are a vast number of other KPIs many of our customers also choose to include, such as working capital and cash conversion cycle metrics, that add significant depth to their dashboards.
The common denominator, of course, is the dashboard. Because they provide companies with a clear pathway to explore and understand their financial past, present, and future.
CashAnalytics is a comprehensive cash flow forecasting software solution used by medium to large-sized corporates for their cash forecasting, reporting, and liquidity planning activities.