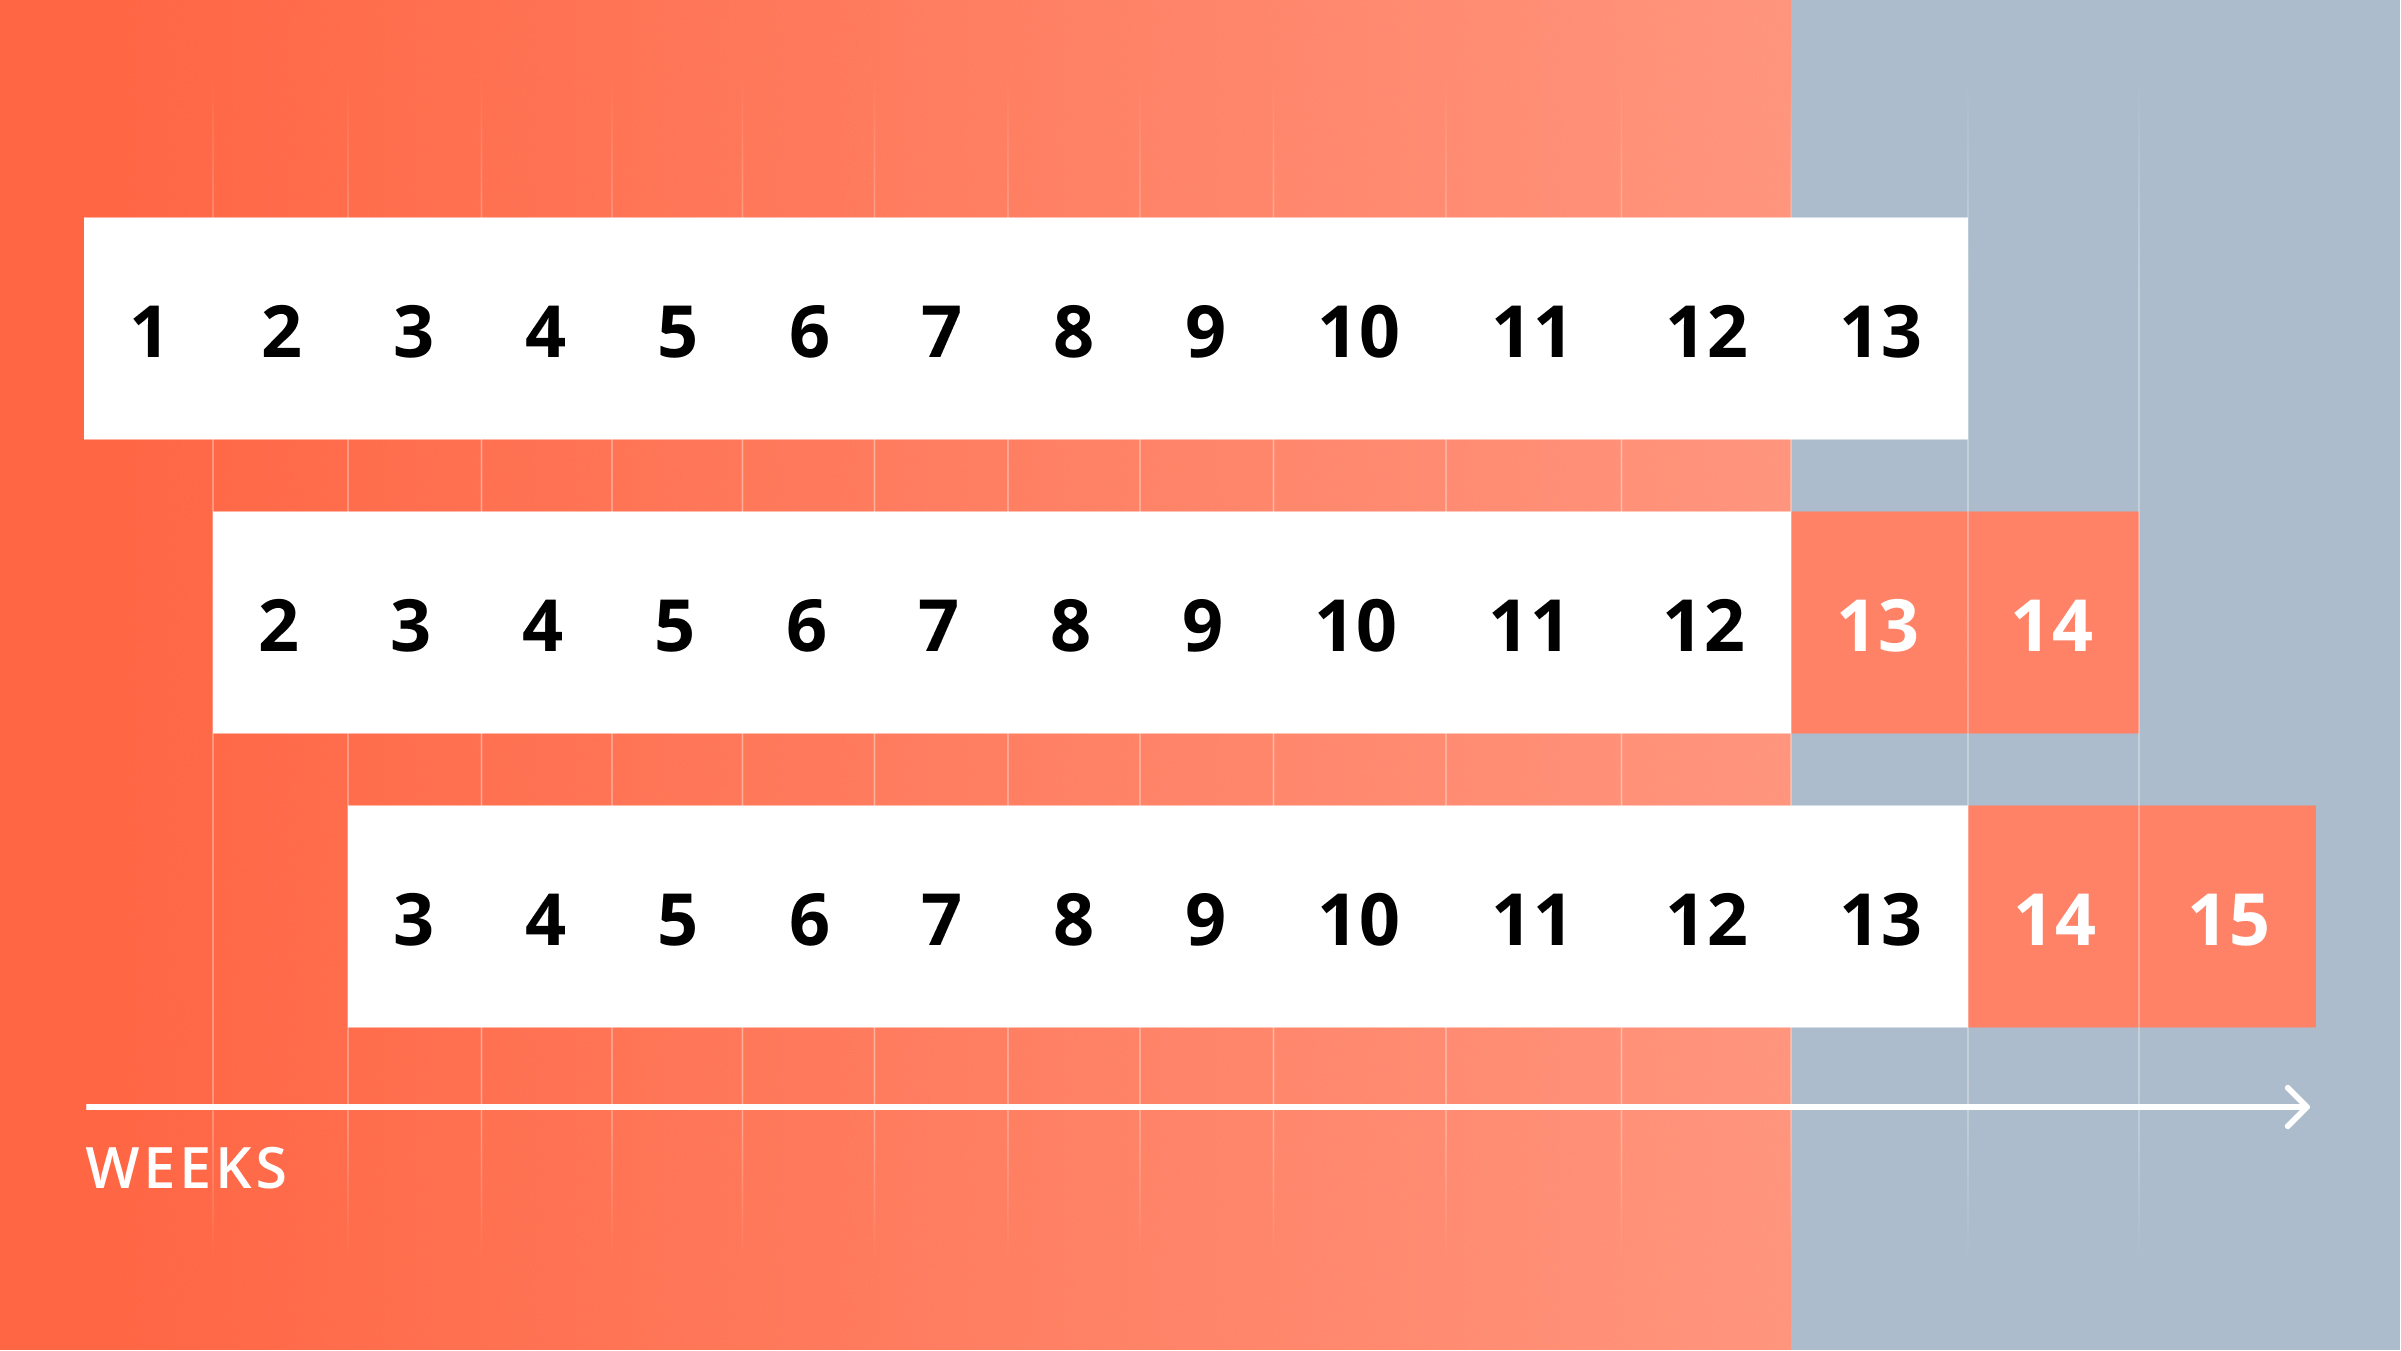
A rolling cash flow forecast is a report that uses historical data to predict the future state of a business on a continuous basis.
Rolling cash flow forecasts are most frequently used for budgeting, supply chain management, and financial reporting purposes (such as cash flow forecasting) because they provide a more accurate view of a business’s financials than static forecasts.
Rolling forecasts also reduce the time and effort required to create a budget and improve the operational and financial performance of a business compared to a static approach. And perhaps unsurprisingly, a 2020 survey of financial professionals by the Association of Financial Professionals found that the majority of those who participated intend to adopt rolling forecasts in the near future.
Here’s why rolling forecasts are a better choice for treasurers and how to build a rolling forecast that supports your business objectives.
How Rolling Cash Flow Forecasts Improve Performance
Rolling forecasts provide businesses with more timely, useful, and accurate information than static forecasts. As a result, they allow management to make better, more timely decisions that help improve profitability, address changes in the market, and plan for risks that might threaten the business.
1. They Improve Agility
Research from McKinsey indicates businesses that respond to changes in market conditions faster see a 20% to 30% improvement in financial performance. Rolling forecasts are a better tool than static forecasts to help you do this because they provide a real-time view of what’s happening in the market and your business.
For example, as each month passes, a rolling forecast projects numbers for the next month automatically using the most recent data available. This provides a more accurate view of changes in market conditions that may be affecting your business, which helps you investigate and correct them quickly.
A static forecast, on the other hand, doesn’t allow you to do this because the data used to build it remains fixed as things change. As a result, a static forecast’s usefulness for making business decisions degrades quickly as the actual position strays from the forecasted position, reducing your ability to identify and respond to changes in a timely fashion.
2. They Enable More accurate financial planning
Aberdeen and IBM found that rolling forecasts improve the accuracy of forecasted and budgeted revenue by roughly 14% when compared to static forecasting and budgeting. That’s because rolling forecasts allow treasurers to adjust their financial planning to marketplace changes in real-time rather than at the end of the period.
For example, if demand suddenly decreases (as it did for many businesses during the COVID-19 pandemic), a static forecast would preclude you from adjusting it to accommodate those changes until the next forecasting period. As a result, you’d have a harder time adjusting things like your capital expenditure plan to accommodate that decrease in demand (revenue).
A rolling forecast, in contrast, would provide you with a more accurate view of future working capital, which would make it easier to optimize the timing of any spending you had planned (or financing you may need to secure).
3. They Reduce Short Term Liquidity Risk
Most businesses understand that mismanaging liquidity could be disastrous for their business. Many have made strides over the last five years to increase the amount of cash they have on hand, according to Price Waterhouse Cooper (PwC).
However, PwC also notes there is still a €1.5 trillion opportunity globally for businesses to improve their working capital positions and that replacing static, historical models with a more transparent approach (like a rolling forecast) is an essential part of doing so.
Simply put, rolling forecasts are better suited to help businesses plan for cash shortages that could shut them down because they provide a more accurate view of future liquidity requirements.
For example, if demand suddenly decreases, a business will have to develop a plan to pay its bills with less income until it increases again. With a rolling forecast, you’d be able to identify where a shortage might occur with greater certainty (and adjust accordingly) because you’re using the business’s most recent data to create your projection.
How to Build a Rolling Forecast (an Example)
Building a rolling forecast is similar to the way you’d build other forecasts but requires you to update your data regularly to ensure it provides the visibility you need. Below is the process we recommend for designing a rolling forecast, using a cash flow forecast as an example.
Note: For large/multinational organizations, building a cash flow forecast is a very involved process. If you’re building a forecasting process for that kind of business, our Cashflow Forecasting Setup Guide goes into the process below in greater depth.
1. Determine Your Forecasting Objective
Building an effective rolling forecast starts with determining what you hope to achieve. For example, are you trying to manage the liquidity risk? Plan for growth? Pay off debts?
Your objective will impact each of the following steps to build your forecast, so it’s essential to determine this first. Since we’re building a cash flow forecast in this example, we find organizations most commonly use them for one of the following reasons:
- Short-term liquidity planning: Managing the amount of cash available on a day-to-day basis to ensure your business can meet its short-term obligations.
- Interest and debt reduction: Ensuring the business has enough cash on hand to make payments on any loans or debt.
- Covenant and key date visibility: Projecting cash levels for key reporting dates such as year, quarter, or month-end.
- Liquidity risk management: Creating visibility into potential liquidity issues that could arise in the future in order to have more time to address them.
- Growth planning: Ensuring the business has enough working capital to fund activities that will help grow revenues in the future.
2. Select A Forecasting Period
There’s typically a trade-off in accuracy between the data available and how far into the future any rolling forecast looks. Choosing the right reporting period can have a big impact on your forecast’s usefulness. Below are the forecasting periods we recommend for rolling forecasts designed to support the business objectives above:
- Short-period forecasts: Rolling cash flow forecasts that look two to four weeks into the future are often best suited for short-term liquidity planning where day-to-day visibility is needed to ensure you can meet short-term financial obligations.
- Medium-period forecasts: Rolling cash flow forecasts that look 2-6 months ahead are most useful for interest and debt reduction, liquidity risk management, and key date visibility. The most common period (and the one we almost always recommend) is the rolling 13-week cash flow forecast, which provides a balance between accuracy and future visibility.
- Mixed-period forecasts: Mixed-period forecasts use a mix of the periods above and are commonly used for liquidity risk management. For example, a mixed period forecast may provide weekly forecasts for the first three months and then on a month-to-month basis for the next six months, adapting to a weekly view as data for future months fills in.
3. Select A Reporting Period
Your reporting period will determine how granular the view of your data will be (daily vs. weekly vs. monthly), as well as how frequently you’ll need to update it. Here are the reporting periods we recommend based on the forecasting period you chose above.
- Daily: For rolling cash flow forecasts that look less than two weeks into the future, you’ll want to update your report daily to make sure you have the visibility needed to manage short-term liquidity.
- Weekly: Rolling cash flow forecasts that project one to six months into the future will be most useful if updated weekly, although it may be better to view your data monthly beyond three months.
4. Source Your Data
A rolling forecast will only be as useful if your data is available, accurate, and complete. Sourcing your data is one of the most crucial steps to ensure your forecast is reliable.
The right place(s) to source your data ultimately depends on the systems and processes your business uses to manage it. For our cash flow example, most of the data you need to build a rolling cash flow forecast can be found in bank accounts, accounts payable, accounts receivable, or your accounting software.
Here’s what you’ll want to pull from those systems:
- Opening Balance: Take this from the most up-to-date and accurate reflection of your current position.
- Cash Inflows: Anticipated sales receipts from within the forecasting period are usually the primary data source for your cash inflows. Other types of cash inflows to consider including are intercompany funding, dividend income, proceeds of divestments, and inflows from third parties.
- Cash Outflows: Typically this would include wages and salaries, rent, investments, bank charges, and debt payments. But you can source anything relevant to your business and objectives.
Keep in mind, collecting the data you need can require the time of stakeholders within your organization. It’s important to ensure they’re bought into the process.
Automation Can Save You More Than 90% of the Work
The hardest part of rolling forecasting for most treasurers (once it’s built) is keeping their models and data up to date. This is especially true for bigger organizations with enormous amounts of data to collect and manipulate.
Automating data collection can save up to 90% of the work required to build and refresh a rolling forecast while also reducing the potential for human error. For example, CashAnalytics customers report saving hundreds of hours building rolling cash flow forecasts while also improving visibility.


