Companies shut their doors for a wide range of reasons — but often, finances force leaders to close their business.
According to CB Insights, 38% of businesses fail because they ran out of cash and were unable to raise new capital. Another article by Formulate shows that previously successful companies fail due to financial factors like lack of funding, mounting debts, huge pension deficits, and more.
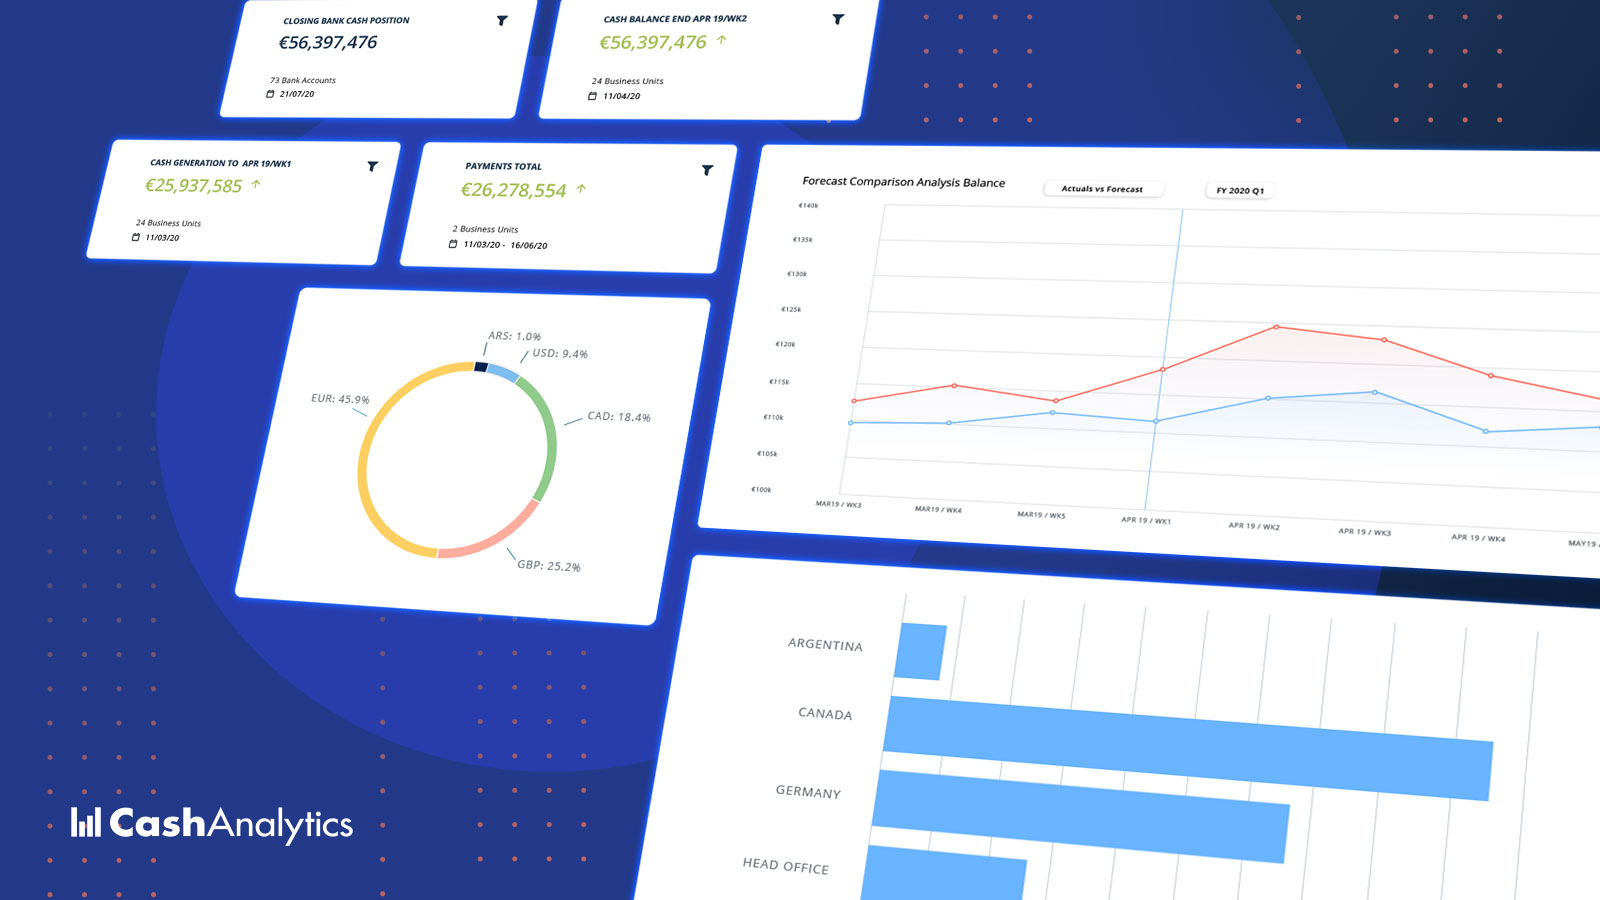
With stakes that high, it’s important that you keep track of your company’s cash inflow and outflow. Cash flow KPIs — when evaluated regularly — are a CFO or financial controller’s most powerful measure of underlying market valuation and profitability.
To analyze your cash flow and minimize financial risks, use these eight key performance indicators.
1. Operating Cash Flow
What Is Operating Cash Flow?
Operating cash flow (OCF) is the cash your business generates from its day-to-day operations, excluding investing and financing activity. This financial KPI shows you the number of times your company is able to pay up debt in any given timeframe.
Also known as cash from operating activities (CFO) or net cash from operating activities, operating cash flow is typically the first section shown in a cash flow statement.
How to Calculate Operating Cash Flow
Operating Income + Depreciation – Taxes + Change in Working Capital = Operating Cash Flow
Pros
Cash from operating activities is a key indicator of your company’s ability to generate cash. By monitoring this financial metric, you’ll identify income and expense sources — then double down on generating and maintaining the cash you need for a smooth business operation.
Operating cash flow is also a measure of financial success because it shows whether your core business operations are booming, and it directly influences liquidity.
Cons
Operating cash flow focuses only on basic business activities like providing services or manufacturing and selling products. The metric doesn’t account for investment revenue, expenses, or long-term capital expenditures, so it gives an incomplete picture of the cash status.
Another downside to this cash flow KPI is that it does not assess your company’s true liquidity position. Operating cash flow does not provide long-term liquidity visibility. You can only tell your firm’s cash balance per day.
2. Free Cash Flow
What Is Free Cash Flow?
Free cash flow (FCF) is the money your company has left after deducting operating expenses, capital expenditure, and major investments. The last one or two sections of cash flow statements often cover FCF and its different variations.
How to Calculate Free Cash Flow
Operating Cash Flow – Capital Expenditures = Free Cash Flow
Pros
Free cash flow gives a clear picture — to your finance team, business owners, investors, and creditors — of cash that you can mobilise at any given time. You’ll know if your company is able to:
- Pay monthly dues (debt interest and investor dividends).
- Carry out expansion activities like buying or setting up a new plant, introducing a new product line, hiring more staff, and more.
- Go after short-term investments like money market accounts, treasury bills, certificates of deposits, and others.
- Collect fresh loans or lines of credit.
- Attract new investors or partners.
- Influence favourable stock pricing.
Cons
While free cash flow is a good measure of profitability, it shouldn’t be used as a standalone indicator.
High free cash flow doesn’t always mean good financial standing — it could be an indicator of inadequate investments in business growth. At the same time, low free cash flow could be a symptom of growth and expansion. For accuracy, always consider free cash flow alongside other KPIs like operating cash flow and cash conversion cycle.
Capital expenditure changes from year to year and across industries. To get a good picture of financial stability over time, observe free cash flow for at least two years. Beyond that, you should also keep in mind industry realities and standards like the average profitability or break-even window.
3. Cash Flow Per Share
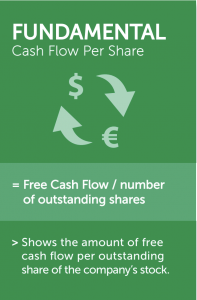
What Is Cash Flow Per Share?
Cash flow per share — also called free cash flow to the firm (FCFF) — is the amount of free cash flow on each outstanding share of your company’s stock. This metric appears as a ratio and shows a company’s earnings per share (EPS) less taxes, depreciation, and amortization.
When you have a high cash flow per share, it means your share value will be potentially high. But if your cash flow per share is low, the odds are that share value and earnings will remain down.
How to Calculate Cash Flow Per Share
Pros
Financial analysts prefer cash flow per share to earnings per share because the former is difficult to manipulate. Cash flow per share accounts for irregular expenses — like depreciation and amortisation — and excludes non-cash earnings like pending accounts receivables.
As opposed to earnings per share, cash flow per share makes it harder for bad actors to alter your company’s cash flow numbers. Because of this reality, cash flow per share gives a more accurate picture of your business’s financial strength and business model vitality. This cash flow KPI also lets you determine your company’s ability to pay dividends and service other expenses.
Cons
One limitation of using cash flow per share is that it doesn’t show your firm’s net income because the calculation doesn’t include non-cash items. These items can only be found in the income statement or balance sheet. For proper analysis, look at your cash flow per share, income statement, and balance sheet together.
4. Cash Flow Yield
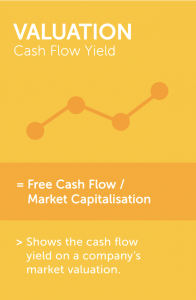
What Is Cash Flow Yield?
Cash flow yield (also called free cash flow yield) is a financial ratio that compares your company’s free cash flow to its current share value.
How to Calculate Cash Flow Yield
Pros
Cash flow yield gives a clear picture of your firm’s ability to access cash quickly. From a cash flow yield calculation, you can tell whether your company is capable of a debt repayment or dividend payment. This metric is particularly key for investors because they always want to know how well their funds are working for them.
When investors are determining whether or not to put money in a company, they may want to see up to 10 years of cash flow yield data and compare it to a treasury note covering the same period. This comparison will help investors calculate the firm’s valuation or determine when a buyout will start generating profit. If cash flow yield is significantly lower than the treasury yield, the company will be considered a poor investment.
Cons
While cash flow yield is a great way to measure your company’s financial position, you should not fully depend on it. This KPI is only truly beneficial when you combine it with a collection of other indicators like cash flow margin or return on invested capital.
5. Cash Conversion Cycle
What Is Cash Conversion Cycle?
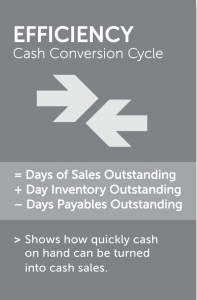
Cash conversion cycle (also called cash cycle or net operating cycle) is a measure of how quickly your company can turn resources — outstanding sales and inventory — into cash. The cash conversion cycle accounts for the average number of days it takes your company to collect receivables and sell off inventory — plus the amount of time you have to pay bills without attracting late fees.
How to Calculate Cash Conversion Cycle
Pros
Because the cash conversion cycle reflects how quickly your firm is able to turn cash investments into returns, this metric helps you save money. You’ll be able to plan around when you expect cash inflow, so you can meet your financial obligations and avoid late payment penalties.
With a short cash conversion cycle, you can convince vendors to let you defer payment for goods. You’ll also gain the confidence to sell inventory on credit.
Cons
The cash conversion cycle is a good measure of your company’s operational and management efficiency — but it only applies to businesses with inventories.
Also, the cash conversion cycle doesn’t provide in-depth financial insight per time. But if you look at the cycle’s trend over time and in comparison with similar companies, you can:
- Give proper reports to management and investors.
- Work on improving the cycle time.
New investors tend to go for companies with a low cash conversion cycle because they make quicker returns. So if an investor has to choose between two companies with similar returns on current assets and shareholder equity, yours will be the best bet.
6. Cash Flow Margin
What Is Cash Flow Margin?
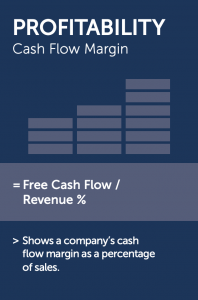
Cash flow margin is a ratio that shows how well your company converts its sales to cash. This ratio tells you the difference between money that has come in from sales and funds you’re still expecting — all of which make up your revenue. Because the cash flow margin compares actual money transfers to pending transactions, it’s a great measure of total revenue quality.
Say you booked a huge sale that boosted revenue but are having a hard time collecting the cash. Your revenue is up, but your cash flow margin isn’t.
How to Calculate Cash Flow Margin
Free Cash Flow/ Revenue % = Cash Flow Margin
Pros
Cash flow margin reflects the actual amount of cash you have from sales, so it is a good measure of real-time profitability. This ratio also shows operational efficiency by presenting how well your firm collects accounts receivables.
Cons
A short-term cash flow margin is prone to inaccuracy. Say your company delays accounts payables to retain cash within the business. A one-year cash flow margin analysis will be off the mark because the cash position has been unduly influenced.
But a company can only defer payments for as long as its line of credit lasts before penalties start to apply. After some time — weeks, months, or years — the firm will need to pay its current liabilities. For a more accurate perspective, stakeholders — investors, management, or creditors — should consider period-to-period cash flow margins
7. Cash Flow Return on Invested Capital
What Is Cash Flow Return on Invested Capital?
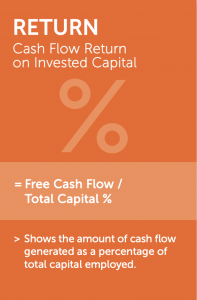
Cash flow return on invested capital (CROIC) is the amount of money your company makes as a proportion of total capital employed.
How to Calculate Cash Flow Return on Invested Capital
Free Cash Flow/Total Capital% = Cash Flow Return on Invested Capital
Pros
Cash flow return on invested capital is a great profitability gauge because it calculates returns against funds employed to generate it. To make returns from investing, you need to create and follow a solid cash management plan. So a positive cash flow return on invested capital shows the strength of your capital investment strategy.
A high cash flow return on invested capital is great, but if your returns aren’t high in the first year or two, it’s not too much of a concern. If your returns consistently decline over multiple financial periods, though, it’s a likely sign of poor cash flow management.
Cons
Capital return on invested capital does not show which business activities are generating what value. This reality makes it hard to accurately monitor and influence cash inflows — especially one-off events like net income from a land or business division sale.
8. Net Debt to Free Cash Flow
What Is Net Debt to Free Cash Flow?
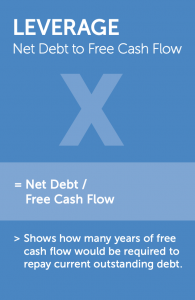
Net debt to free cash flow is a measure of how many years of free cash flow you’d need to repay your current outstanding debt.
How to Calculate Net Debt to Free Cash Flow
Net Debt/ Free Cash Flow = Net Debt to Free Cash Flow
Pros
Net debt to free cash flow shows your ability to pay off debt quickly, so it’s a great indicator of financial stability (or lack of it.)
Cons
Typically, needing a few instead of many years to pay off outstanding debt is a sign of economic resilience because it means either of the following:
- You owe very little.
- Your cash conversion cycle is short.
But sometimes, too little debt could be a red flag because it means your firm is not investing enough in ongoing growth to remain competitive.
Beyond Tracking Cash Flow KPIs, Use CashAnalytics for Quick Scenario Analysis
Cash flow KPI tracking allows you to regularly gauge your business’ financial health and minimise risk. But even with this monitoring, the unexpected can happen — like a pandemic or recession — and destabilise your business.
Prepare for potential volatility with scenario planning. With CashAnalytics’ robust suite of analytics features, you can quickly access financial data — and conduct scenario analysis. Book a free demo to see how our tool helps you track and predict cash flows.