In a recent post, we discussed how data visualisation techniques can be used to uncover insights in cash forecasting data.
That post offered examples of cash forecasting data visualisations and demonstrated how they enable users to spot insights that might be missed when simply wading through raw data.
These insights help finance and treasury teams add value back to the business and help position those teams as increasingly strategic.
The other key use of data visualisations is in communicating these insights back to the business, whether that is in the form of a presentation to the CFO or board report, for example.
This post will therefore examine holistically, how data visualisation tools are accelerating the rise of finance and treasury teams, as they become of increasing strategic importance within businesses.
The increasing value of data driven insights
Uncovering data-driven insights and communicating them effectively are two key challenges facing finance and treasury teams in today’s fast-moving business environment.
While understanding the numbers continues to be a valuable skill, being able to explain what signals in data mean and why they matter is also increasingly important.
This becomes even more pertinent as finance and treasury teams tap into expanding internal and external data sources in search of insights that give a deeper view of what drives their organisations’ performance. This is discussed further in our post on big data in finance.
Seeking to put a numeric value on the increasing value of data driven insights, technology research firm Nucleus investigated the ROI of companies that invested in analytics. The results of their study, released earlier this year, showed that companies average a return of over $9 for every dollar invested in analytics software.
Focus on forecasting
Looking within analytics, the emphasis in financial and management reporting is shifting from hindsight to foresight.
The most valuable signals uncovered by data analytics are the ones that help forecasting and offer insights into what’s coming down the tracks.
This is aided by tools that provide dashboards and data visualisations, and put real-time data at the user’s fingertips.
Data visualisations to strengthen communication
Data visualisations can explain the impact of situations to an extent that can be impossible to achieve with written, verbal, or raw data communication.
To cite an example where the importance is literally life and death, Project Tycho (within the University of Pittsburgh) released data on the introduction of the measles vaccine in America, enabling this data visualisation from Deloitte:
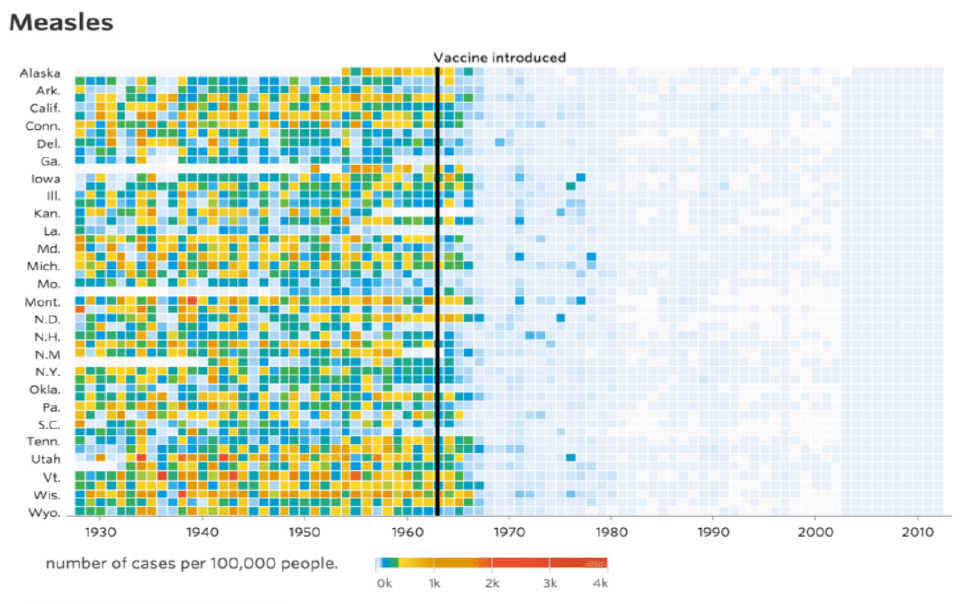
This type of visualisation is extremely powerful as it shows a clear watershed moment, and can present a far stronger case than might otherwise be possible with prose, or even simple data charts.
Back in the corporate world, it is evident that these techniques help treasury and finance teams not just when engaging within the business, but also when communicating in the boardroom or with investors, analysts or other stakeholders, therefore further positioning the strategic importance of treasury and finance within the business.
Elsewhere, McKinsey Institute cites the example of a European technology company that no longer uses PowerPoint. “Business leaders instead use large touch screens to access real-time data about finances and operations. The information is presented in easy-to-read graphs that highlight deviations from plan. The graphs are dynamic, redrawing themselves as users swap variables in and out.”
Relieving the admin burden and focusing on analytics
In the banking sector, data visualization is evolving from a ‘nice-to-have’ to a ‘must-have’, says Accenture’s Aron Elston. “More than anything, visualization tools transform data into something visual, tangible and relatable, a key to gaining stronger buy-in for key Bank’s data-driven decisions.”
Accenture estimates that analysts typically spend about 80 percent of their time on data load and preparation, and only 20 percent on producing analytics. “That means much more time is spent on cleaning, re-forming, and associating messy, disparate data, than on visualizing and analyzing the results,” says Elston.
The key, therefore, is to facilitate the data load with automation as much as possible.
As we explored in this post on cash forecasting automation, removing the administrative burden from the process frees up treasury and finance teams to spend more time on the higher-value analytics activities. This is where these teams can add real value to the intended audience, whether this is the CFO, the leadership team, other departments, regulators or stakeholders across the wider business.
This is easier said than done. All organisations become more complex over time and the challenge of managing data from multiple systems, geographies, processes and people is one of the reasons why technologies that can improve efficiency and reduce error are gaining traction among finance and treasury teams.
The power of clean data
A critical task in finance and treasury teams is to ensure that the data being presented and analysed is reliable, accurate and relevant.
Data quality should be a priority during technology investment conversations, says Deloitte. “Many organisations are using reporting tools and data visualisation dashboards. However, if the issues with the underlying data are not resolved there is a risk that the inadequacies previously found in spreadsheets are replicated in the newly implemented technology.”
To offer insight into how one might go about cleaning a large data set (such as those required for cash and liquidity forecasting) this post examines the area in detail, and outlines the importance of clean data in the process.
Finance and treasury taking ownership of the process
In a recent Forbes Insights interview, James J. McKinney, CFO of Kemper Corporation, observes that finance responsibilities now extend to managing technologies such as visualization, data analytics, robotic process automation (RPA), artificial intelligence and cloud.
These technologies are typically modular and can be deployed quickly and cost-effectively, helping organisations to adapt and become more agile.
Increased access to data means that teams need tools capable of taking in data from diverse sources and outputting insight and reports through diverse delivery mechanisms.
Furthermore, the introduction of these software capabilities within finance and treasury teams reduces the reliance on IT for customised reports, and enables them to be a more self-sufficient business unit.
Bridging the business analytics skills gap
As data visualisation competency becomes a ‘must have’, finance and treasury teams will need to upskill within their teams. Less than a quarter of finance leaders who participated in recent AICPA/Oracle research rate the data visualisation skills of their finance function as ‘excellent’ compared to 60 percent of agile finance leaders.
However, as we discussed in a recent article on bridging the business analytics skills gap, there are now many options open to business leaders looking to incorporate these new skills within their teams. These include a range of different courses that can be used to train existing team members, as well as hiring options and considerations as the team expands.
Highlight key messages, don’t drown in detail
When using data visualisations in reports and presentations, a key point to bear in mind is that reporting too much detail — whatever the format — will make it difficult for an audience to grasp key messages.
It must be remembered that the objective of these reports and presentations is to communicate clear messages. Therefore finding the visualisation that presents that message strongly, and then articulating the points around it, will be far more effective than stuffing a report full of different graphs.
However tempting it is to delve into the detail, less is usually more.
Focusing on what is interesting and relevant for your audience — whether an individual business unit, a committee, or the CFO — is key.
Understanding the business needs
Finally, it is important to remember that new technologies must be suited to business needs.
This is always an essential first step in identifying what is working in individual business units and where the opportunities are to enhance performance. The better finance and treasury understand the business, the better equipped they will be to use data visualisation and analytical tools to deliver a broader and deeper view of what really drives their organisation’s performance.
It is that business understanding that unlocks the true potential of data visualisation, and therefore aids in finance and treasury teams rise to strategic business partner.
About CashAnalytics
As a dedicated cash flow forecasting software provider, CashAnalytics offer a range of data visualisation tools that improve our clients’ cash forecasts both by helping users to uncover insights, but also to help those insights be communicated back to the business.
If you would like to see a demonstration of our software, where we can run through exactly how these data visualisation techniques can really benefit treasury and finance teams, please contact us directly, or request a demo now.