Accurately forecasting cash positions becomes increasingly important as interest rates rise, due to the opportunity cost of holding uninvested cash.
At its recent monthly meeting the U.S. Federal Reserve increased the Federal Funds rate from 1.5% to 1.75% and indicated rates will rise faster than previously anticipated. The new Fed Chairman has taken more hawkish stance on rates than his predecessor Janet Yellen as he attempts to cool a U.S. economy that is growing faster than originally forecast.
In an environment where rates are rising and are expected to do so for the foreseeable future, the direct cost of debt and the opportunity cost of holding uninvested cash both increase significantly. Therefore, the quality and accuracy of cash forecasts used to plan for future liquidity needs come into sharp focus.
In other words, as rates increase, the cost of inaccurate cash forecasting can become a significant penalty.
Measuring Accuracy is a Challenge
In large organisations, cash forecasting requires the collection of vast amounts of data from a wide array of sources. Because of this, measuring the accuracy of a cash forecasts is not a straightforward task, simply due to the volume of data points that have to be analysed and the amount of work involved in carrying out a thorough analysis.
As actual cash data is required to measure the accuracy of forecasts, the level of data available to a treasury and finance team will determine which elements of the forecast can be analysed. For example, if only closing cash balances can be accessed, it is only the closing cash positions in the forecast that can be measured. Whereas if transactional cash flow data is available, other components of the forecast, such as operating and investing cash flows, will be able to be analysed for accuracy.
Decide What to Measure
Choosing what to measure, and how frequently to measure it, is the first step in understanding forecast accuracy. Analysing closing cash positions and net cash movements will provide a good gauge of overall forecast accuracy. Cash generation and working-capital based analysis will give a better understanding of cash flow performance, although this will require more forecast and actual detail.
Choosing the component of the forecast that means most to a business, and then measuring it, is a good starting point.
Once metrics are chosen, the time horizon will need to be selected. As with choosing a component of the forecast to focus on, it is important to select the time-period or date that matters most to the business. Whether this is month-end, year-end, or a monthly debt rollover, once the key dates/times are identified, the forecast reporting processes should be built around them.
Choose a Simple Method of Accuracy Measurement
There are various methods that can be used to measure accuracy. Below is a high-level view of two of those methods, “Single Period Actual versus Forecast” and “Count Down Accuracy Analysis”.
As would be expected from the name, a single period versus actual forecast is useful for single period analysis such as week-on-week or month-on-month. Forecast accuracy is best described through a percentage and can be calculated by dividing the gap between the actual and forecast figure, by the actual figure.
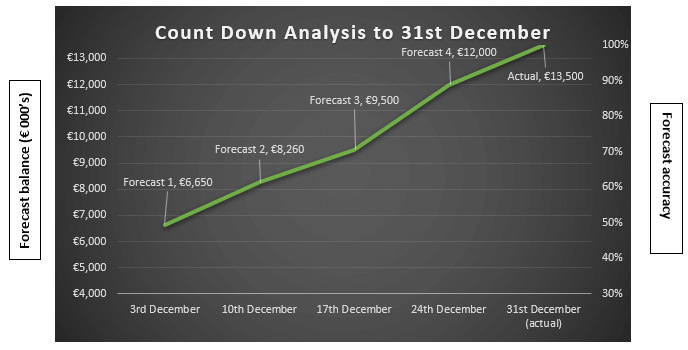
A count down accuracy analysis involves measuring a number of different forecasts which are made in the approach to the target date. These forecasts can then be analysed for accuracy as soon as the actual figure or flow on the closing date is known. For example, the table below shows four forecasts made for the December 31st closing cash position in the lead up to the target date. The actual figure for 31st December in this example is €13,500,000.
| € 000’s | Date of forecast | Days to target date | Forecast for 31st December | Difference vs actual | Forecast accuracy |
| Forecast 1 | 3rd December | 28 | 6,650 | 6,850 | 49% |
| Forecast 2 | 10th December | 21 | 8,260 | 5,240 | 61% |
| Forecast 3 | 17th December | 14 | 9,500 | 4,000 | 70% |
| Forecast 4 | 24th December | 7 | 12,000 | 1,500 | 89% |
As could be expected, the accuracy percentage increases as the target date approaches.
Presenting the results of the analysis as a graph helps to give a clearer picture of trends in the forecasts. In this example, each of the forecasts was overly conservative, and achieved only 49% accuracy four weeks before year-end, rising to 89% accuracy one week before year-end.
Keep the Analysis Focused
To provide high quality analysis, the forecast reporting processes should be targeted. If the methodology is overly complex, it can prove difficult to identify trends and make the necessary improvements. Choosing the most important metric, and the most relevant time horizon, enables accuracy measurements that are easy to understand and straightforward to explain.
Follow this link to download our full whitepaper on measuring cash forecasting accuracy.


